The problem
Oil and gas operations produce a lot of numbers — production volumes, equipment metrics, time-series data spread across systems. Raw tables don't help anyone make a decision quickly. The brief was to turn that data into something a non-technical operator could actually read and act on.
What I built
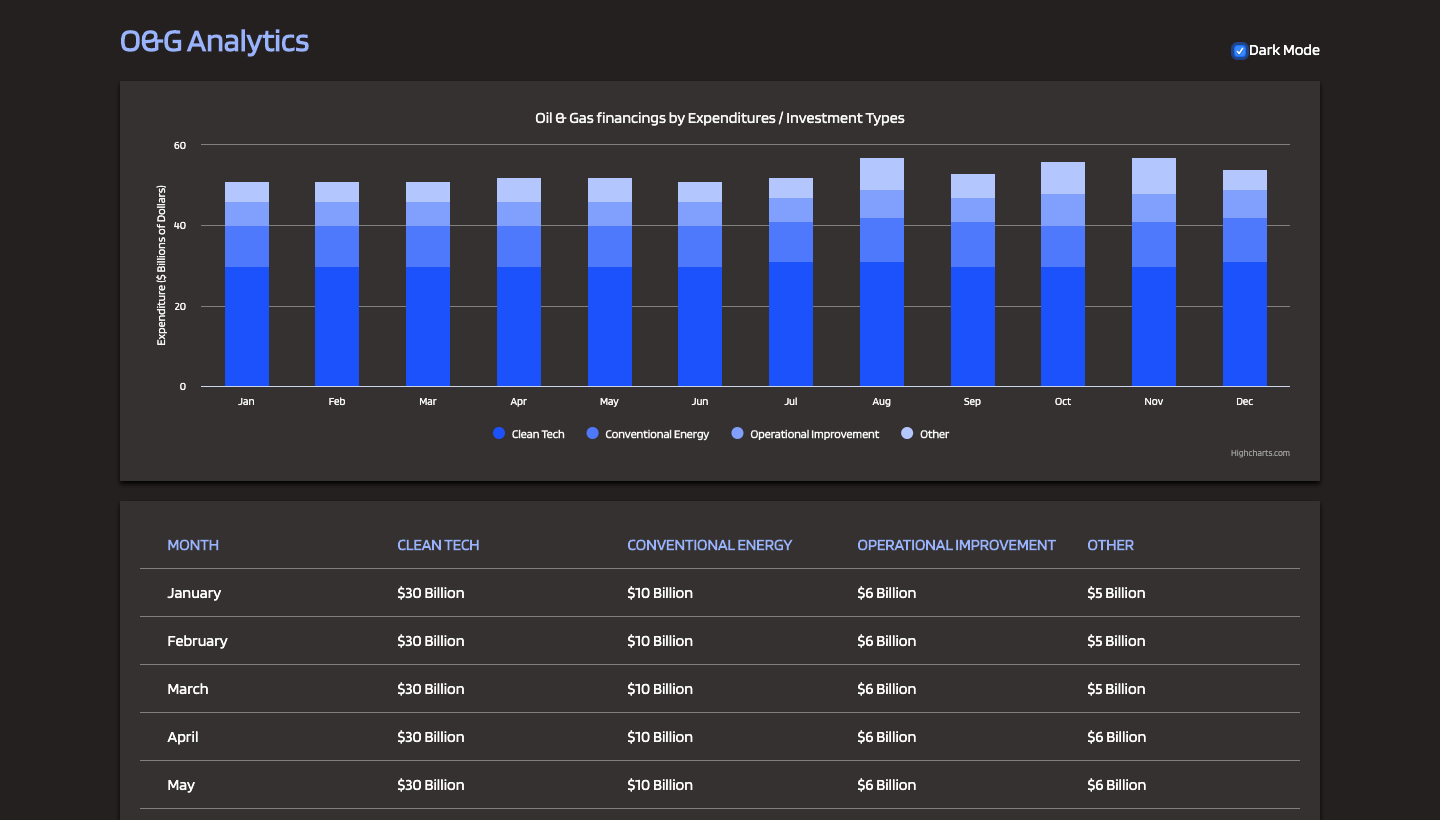
A React-based analytics dashboard that pulls operational data through an API and renders it with Highcharts — line charts for trends over time, comparison views across sites, and summary metrics up front so the most important numbers don't require digging.
How it's built
- Frontend: React, componentized around reusable chart and metric-card patterns
- Visualization: Highcharts, configured for time-series and comparison views
- Data: Consumed via REST API integration, with the frontend handling shaping and formatting for display
What it demonstrates
This project is less about breadth of stack and more about depth in one area: taking a real, unglamorous business dataset and building the UI layer that makes it usable — API integration, data shaping, and chart configuration that has to be correct, not just good-looking.